A Case Study Using the Met One Instruments BAM 1020 During Wildfire Season
Introduction
The Met One Instruments, Inc. BAM 1020 is used extensively in government air quality monitoring networks worldwide to measure PM2.5 and PM10. The data collected from these instruments are often reported to the public as measured PM2.5 or PM10 in micrograms per cubic meter (μg/m3). It is also frequently used to compute an Air Quality Index “AQI” or a NowCast index either instead of or in addition to the direct PM2.5 or PM10 readings.
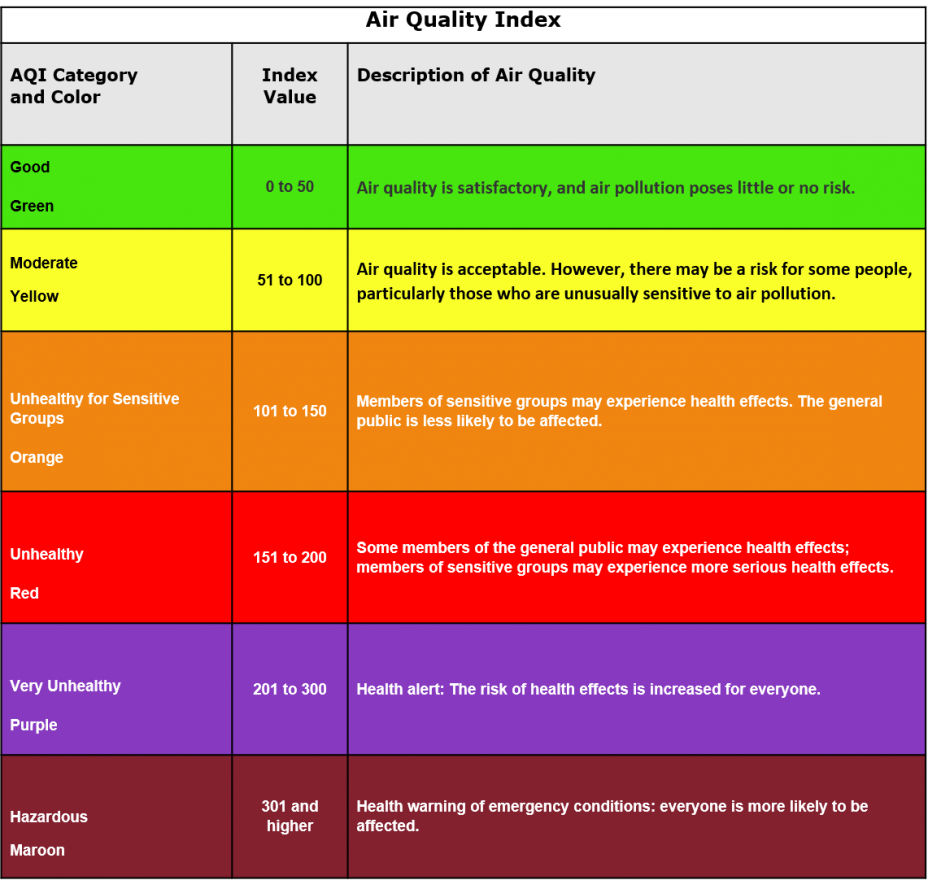
The AQI or NowCast indices are usually reported along with a color code that indicates the air quality with respect to the pollutant being reported. Green shows good air quality, yellow shows moderate air quality, orange shows unhealthy for sensitive groups, etc.
This application note will present a case study of how to compute these indices from raw data produced by the BAM 1020. We will then discuss the advantages and disadvantages of using the raw data compared to the AQI or NowCast indices.
Background
In the summer of 2018, huge forest fires burned for several months in southern Oregon and northern California. These fires burned thousands of square miles of forest and were not completely extinguished until seasonal rains arrived in the fall.
Met One Instruments, Inc. is headquartered in Grants Pass, Oregon, and was close to the epicenter of the summer 2018 fires. We operate BAM 1020 monitors at our corporate headquarters continuously and recorded the events by tracking PM2.5, a criteria pollutant associated with combustion for the duration of these events.

PM2.5 is particulate matter whose diameter is less than 2.5 microns in diameter. For comparison purposes, a human hair is approximately 75 microns in diameter, therefore about 30 times the width of PM2.5 particulate matter. The human eye cannot see individual 2.5-micron particles. However, when present in large concentrations, they have the effect of reducing visibility. At high concentration levels over extended periods of time, PM2.5 is a serious health risk. The US-EPA has designated PM2.5 as a criteria pollutant and has mandated its extensive monitoring nationwide. Therefore, there is great interest in accurately monitoring and reporting it.
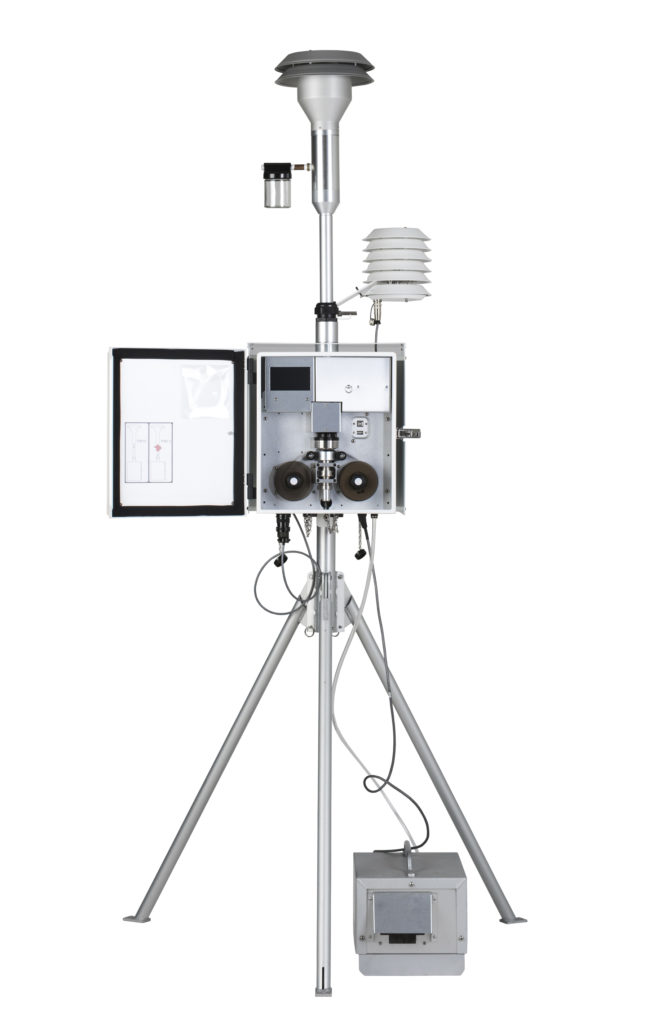
The BAM 1020 Beta Attenuation Mass Monitor is US-EPA designated for continuous PM2.5 monitoring and is used extensively in air quality monitoring networks worldwide. In its standard configuration, the BAM 1020 will measure and then report PM levels with high accuracy on an hourly basis.
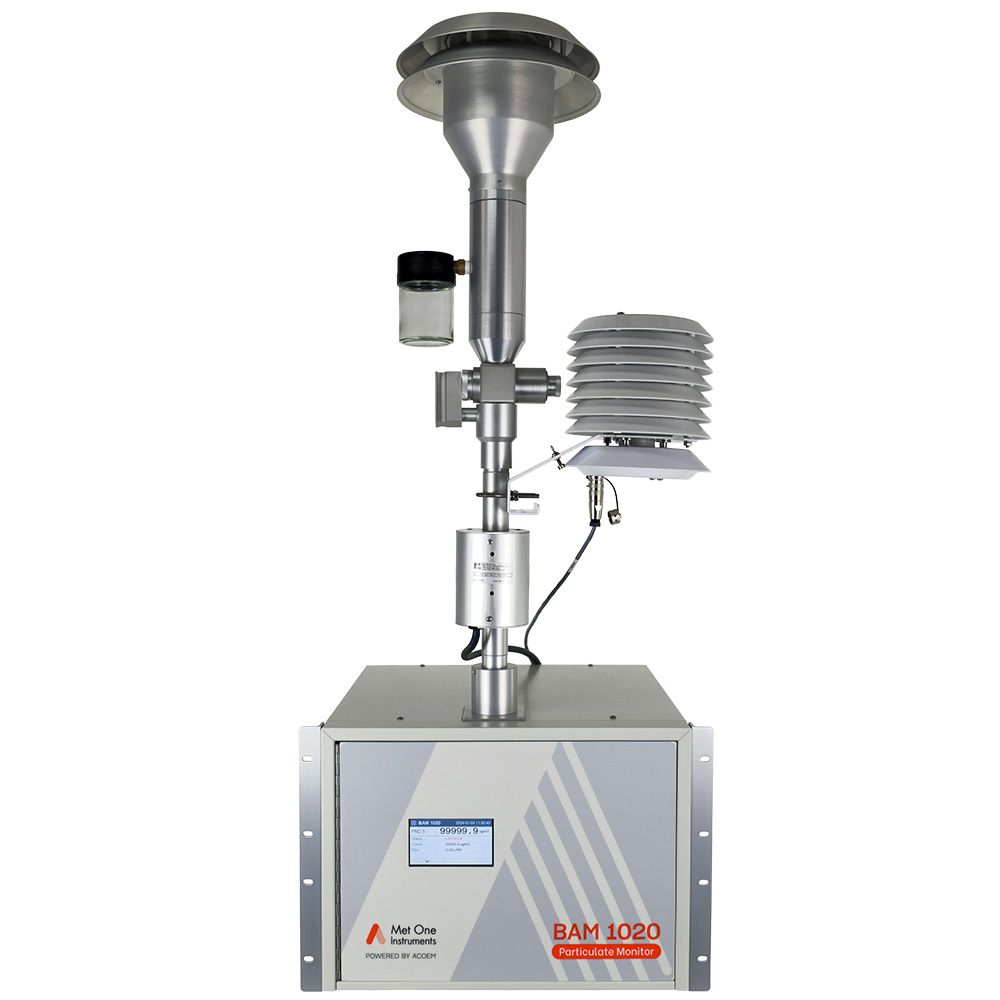
Beta gauges are insensitive to the chemical composition, particle size distribution, color, index of refraction, or other optical properties of PM. This is especially important when monitoring PM during fires as woodsmoke causes erroneous, inaccurate measurements on commonly used PM monitors employing optical methods.
Direct PM2.5 Measurement
The US-EPA has established standards for PM2.5. The current annual concentration standard for PM2.5 is 12 μg/m3. The current daily concentration standard for PM2.5 is 35 μg/m3. There is currently no US-EPA hourly standard for PM2.5. Most of the time in southern Oregon, where the Met One Instruments headquarters is located, PM2.5 levels are quite low as the population is low (about 35,000 for Grants Pass city and 83,000 for Josephine County).
We have operated a BAM 1020 beta attenuation mass monitor configured for PM2.5 measurement for many years at this location. The BAM 1020 reports PM2.5 with a 1-hour time resolution continuously. This data may be used directly for air quality assessment. However, it is most often converted into the color-coded AQI or NowCast index values for public reporting purposes.
Air Quality Index “AQI”
The PM2.5 AQI is an index developed by various governmental agencies such as the US-EPA, or China’s CNEMC, to convey how polluted the air is with respect to PM2.5. The computational formulae used for AQI calculation varies depending on the regulatory jurisdiction. For the purpose of our discussion, we will use the computations used by the US-EPA.
As we shall see, the AQI is not always a good predictor for future air quality. Unlike direct PM measurements, AQI is a unitless number that varies from 0 to more than 500. PM2.5 AQI is a midnight-to-midnight 24-hour value based on 1-hour measured values. The PM2.5 AQI is computed from the following formula where Ip = AQI:
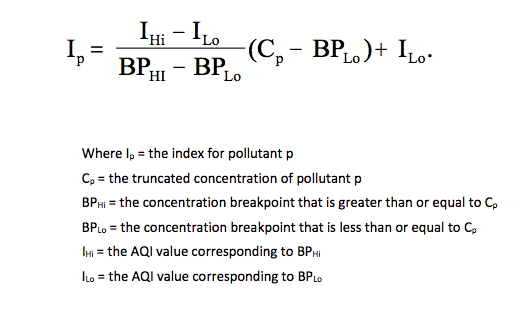
24 1-hour measured PM values from midnight to midnight are needed to compute the Air Quality Index “AQI.” In this computation, it is necessary to know the breakpoints between the AQI categories. These are given below in Table 1.
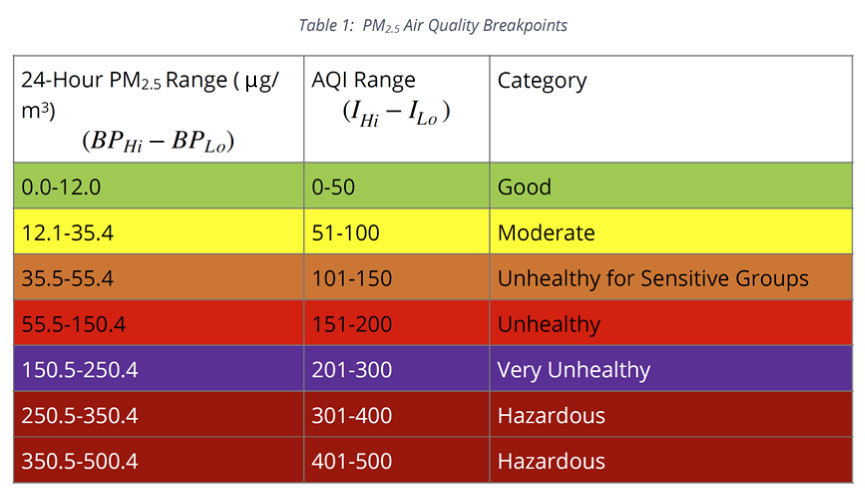
In Table 1, the first column shows the 24-hour PM2.5 range (low breakpoint to high breakpoint) for “Good” air quality. This corresponds to an AQI ranging from 0 to 50. Therefore, if the 24-hour integrated PM2.5 concentration were 6.0 μg/m3 (Cp), BPHi would be 12.0 μg/m3, BPLo would be 0 μg/m3, circumstances IHi would be 50, and ILo would be 0. The PM2.5 range of 0 μg/m3 to 12 μg/m3 corresponds to the AQI range (IHi − ILo). Therefore, for a daily PM2.5 average concentration of 6.0 μg/m3, the AQI would be calculated in the following manner:
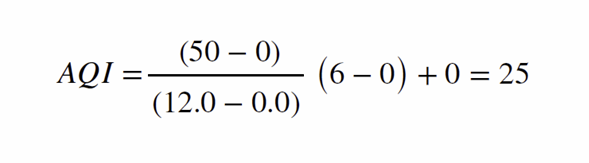
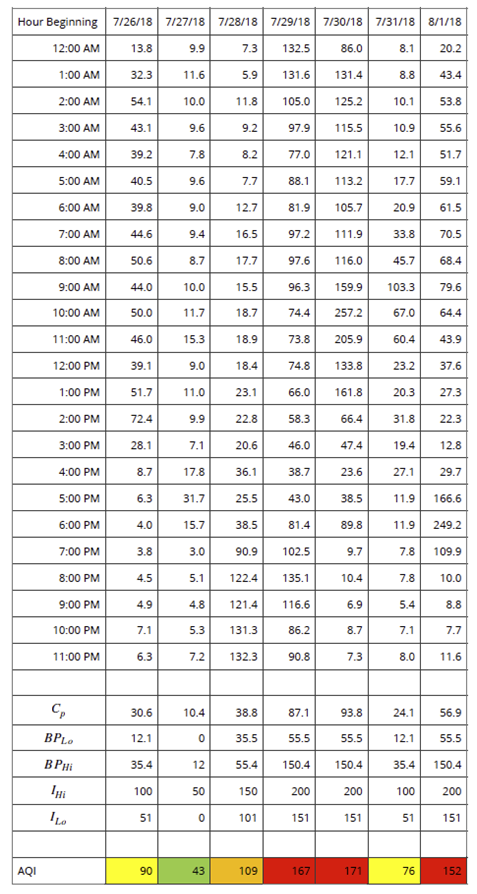
A PM2.5 AQI of 25 denotes good air quality and would be in the “green” zone. We will determine the AQI for actual PM data collected from our Grants Pass, Oregon corporate headquarters during a fire event during the summer of 2018. Table 2 shows AQI being calculated from actual hourly PM2.5 data collected during July and August 2018 at the beginning of a smoke episode.
As can be seen from Table 2, the maximum hourly PM2.5 concentrations often substantially exceed the daily PM2.5 average. The AQI is only available for the previous, complete 24-hour period meaning that this index is not useful for reporting current conditions because current PM2.5 measurements will not be incorporated into the AQI until the following day.
NowCast AQI
Consequently, the US-EPA developed an alternate air quality index known as NowCast AQI that uses the most currently available hourly PM2.5 air quality data to compute the NowCast index. NowCast relies on the most recent 12-hour period of air quality data to compute the index. However, because of weighting factors in the NowCast computational algorithm, during periods of rapidly changing PM2.5 concentrations (either up or down), NowCast closely tracks a 3-hour average converted into an AQI. During periods where the PM2.5 concentration is not rapidly changing, it does not. NowCast, therefore, has the advantage of being based on the most recent air quality data.
The NowCast computation for PM2.5 is taken directly from the US-EPA airnow.gov Website:
Use the past 12 hours of PM measurements in micrograms per cubic meter (μg/m³):
- Select the minimum and maximum PM measurements.
- Subtract the minimum measurement from the maximum measurement to get the range.
- Divide the range by the maximum measurement in the 12-hour period to get the scaled rate of change.
- Subtract the scaled rate of change from 1 to get the weight factor. The weight factor must be between .5 and 1. The minimum limit approximates a 3-hour average.
- If the weight factor is less than 0.5, then set it equal to 0.5.
- Multiply each hourly measurement by the weight factor raised to the power of the number of hours ago the value was measured (for the current hour, the factor is raised to the zero power).
- Compute the NowCast by summing the products from Step 6 and dividing by the sum of the weight factor raised to the power of the number of hours ago each value was measured.
- Convert this value to an AQI. A concentration-to-AQI converter is available on the EPA's website: NowCast Calculator
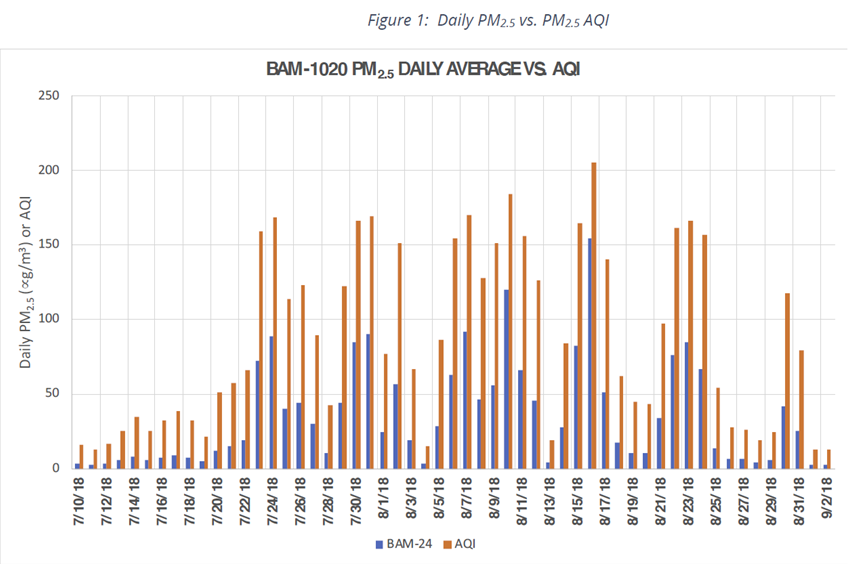
Figure 1 shows the daily PM2.5 average computed from the BAM-1020 configured as a US-EPA designated federal equivalent method “FEM” compared to the PM2.5 AQI. Both are shown on the same y-axis.
The daily PM2.5 average can change substantially from day to day. Therefore, the usefulness of the previous day’s AQI value as the sole predictor of the current air quality is limited, especially when the local air quality is severely impacted by forest fires and can change rapidly. This is shown in Figure 2, the previous day’s PM2.5 average is used to predict the current day’s PM2.5 average.
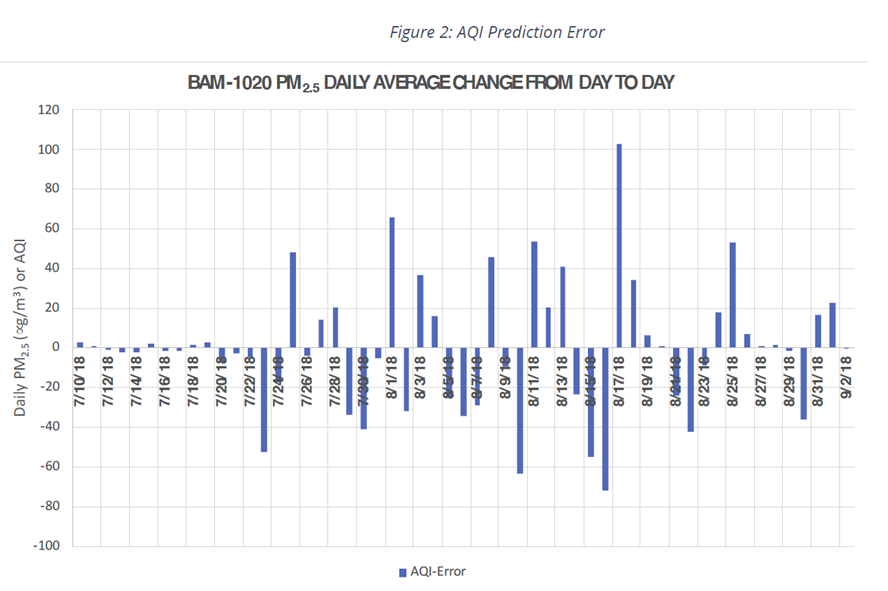
Generally, local PM2.5 measurements are combined with additional information, including meteorological data, to forecast the coming day. As can be seen from Figure 2, the prediction error for the current data set could be ± 100 μg/m³ from day to day. We computed the RMS error to be 24.9 AQI units based on 102 days of data.
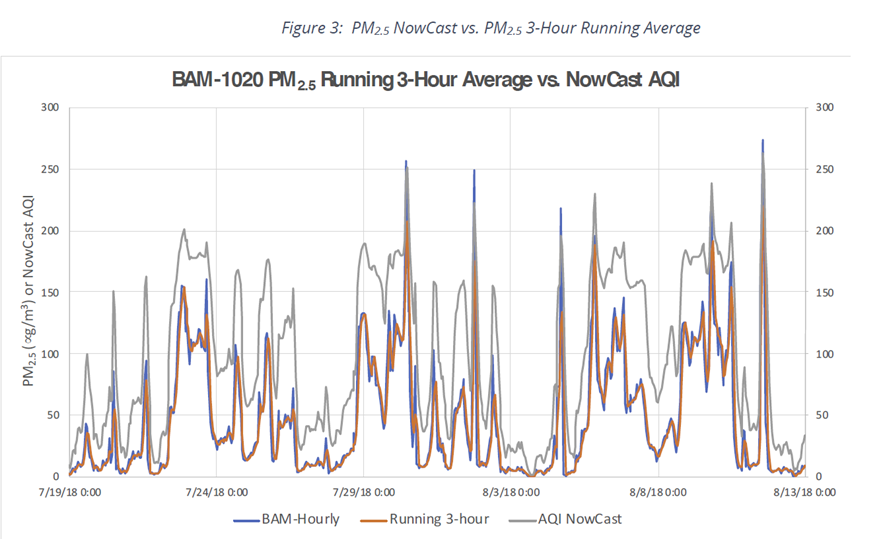
With NowCast AQI, the effective time resolution shifts from 24-hours to the most recent 3-hours, when PM2.5 concentrations are rapidly changing. Figure 3 shows the relationship between the NowCast AQI computation and the running 3-hour gravimetric BAM 1020 output for PM2.5. The running 3-hour PM2.5 value and the NowCast AQI value track one another reasonably well.
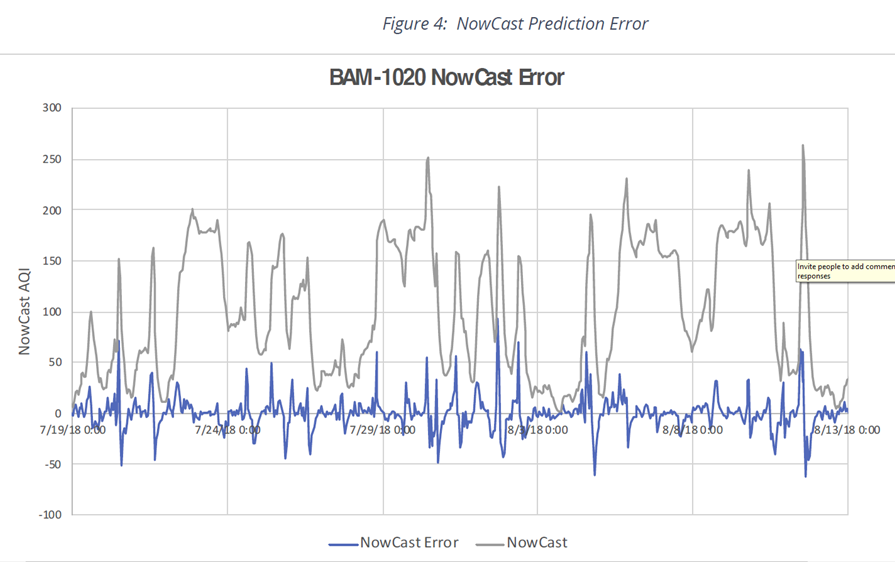
Figure 4 shows the NowCast computation from the hourly BAM 1020 data and the error in using the current hour’s NowCast value to predict what the next hour’s NowCast value is going to be. As you can see, the error is much smaller for the NowCast AQI than the corresponding error is for the standard AQI computation. We computed the RMS error for the NowCast AQI to be 13.1 NowCast AQI units, around 50% lower than the RMS error for the AQI computation. This result should not be a surprise as the NowCast AQI is updated hourly, whereas the standard AQI is updated only once per day. However, NowCast AQI uses the most recent 12 hours of data to compute the NowCast AQI index for rapidly changing concentrations, as might be seen during a special event such as a fire.
Discussion & Conclusion
Met One Instruments, Inc. beta gauges such as the BAM 1020 beta attenuation mass monitor are ideal for computing AQI and NowCast AQI values because of their inherent accuracy and their ability to produce data with a minimum of one-hour time resolution. AQI computations are based on the most recent midnight-to-midnight data collection period, whereas NowCast AQI is based on the most recent 12-hours of PM data.
Furthermore, if the PM levels are rapidly changing up or down, then the NowCast AQI may be approximated from the most recent 3-hours of PM data, meaning that NowCast AQI uses PM measurements up to and including the most recent hour to perform its computations. Because the BAM 1020 generates updates once per hour and other Met One Instruments, Inc. beta gauges, such as the BAM 1022, E-BAM, and E-BAM PLUS all can produce highly accurate PM updates on time scales shorter than one hour, all devices are suitable for computation of both AQI and NowCast indices. Reference samplers can collect only 24-hour integrated samples and therefore cannot be used for NowCast AQI computations. In addition, filter media collected from reference samplers must be sent to a lab for equilibration and reweighing. This process often takes several weeks meaning that AQI computations arising from reference sampler data will be of no use in predicting air quality.
Based on the data that we collected at our facility in Grants Pass, Oregon, during the fire events in the summer and fall of 2018, we have shown that the AQI was of minimal use by itself in predicting the subsequent AQI value during the next 24-hour midnight-to-midnight period as frequently there were massive changes up or down in the reported AQI from one day to the next. We showed that during the same events, the NowCast AQI was generally a better predictive tool in anticipating future NowCast values.
Want to Learn More?
🔗 Visit the US EPA website to learn more about using the Air Quality Index when making plans.
🔗 Dig deeper into the status and trends of different airborne pollutants in the United States.