Source Apportionment & Mass Measurement of Fine Particulate Matter Arising from Massive Southern Oregon & Northern California Fires During the Summer of 2018
David A. Gobeli, Ph.D., Jennifer Brown, Met One Instruments, Incorporated
Abstract
Black carbon “BC,” brown carbon “BrC,” and continuous gravimetric PM2.5 were measured in Grants Pass, Oregon, during a series of devastating, lightning-induced wildfires in southern Oregon and northern California the summer and fall of 2018. The equipment was set up at a monitoring site which, at times, was within a few miles of one or more of the active fires. BC and BrC were measured using portable and rack-mounted, tape-based carbon monitors of two and ten illumination wavelengths respectively. Total mass in the form of PM2.5 was continuously measured during the event using a class 3 US-EPA designated beta attenuation mass monitor “BAM” and a high-temporal resolution optical PM monitor. All monitors were collocated. Monitoring results reveal an excellent correlation between BrC and PM2.5 and a fair to good correlation between BC and PM2.5. BC, measured at 950 nm, was typically 2-5% of gravimetric PM2.5. BC, which is normally present in low concentrations (< 0.300 mg/m3) because of the low population density of the region, was measured at concentrations approaching 10 mg/m3during the event. BrC, which is normally almost non-existent in the region during the summer months, except during forest fires, was recorded at concentrations close to 50 mg/m3 using only UV (370 nm) illumination. Sandradewi’s and other source apportionment methods were also evaluated using different combinations of illumination wavelengths and equivalent black carbon “EBC” wavelengths. Wide variations in the BrC/EBC fractions were observed at the commonly used 470 nm/950 nm illumination combination over time, perhaps because of varying distances between active fire events and the fixed monitoring sites. Also, wide variations were noted in the differences between reported BrC/EBC fraction as a function of UV and IR illumination wavelength combinations.
Introduction
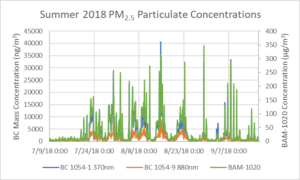
Wildfires wreaked havoc on the air quality of Southern Oregon in the summer of 2018. Approximately 115 fires were started from lightning strikes on July 15 alone. Some of these grew into complexes, and they continued to smolder for months. The graph below shows the typical particulate concentrations in the air for 20 days before the extremely high levels seen when the fire smoke hit the valley after July 19th.
Met One Instruments is positioned in Grants Pass, Oregon, in the middle of most of the large fires that occurred in South Western Oregon. We were able to monitor the particulate fall-out from the fires with many of our products. Two BAM-1020 beta gauge measurement units, an E-Sampler nephelometer, a 10 wavelength BC 1054 black carbon monitor, and a 2 wavelength BC 1060 portable black carbon monitor were set up outside to measure the impacts from the fires.
Source Apportionment Quantification Using the Aethalometer Model Method
Tape-based carbon monitors measure the transmission of light through filter media onto which particulate matter “PM” containing black carbon “BC,” brown carbon “BrC,” and other PM is being deposited. BC originates from the incomplete combustion of fossil fuels and is mainly composed of soot-like (sp2) carbon. BrC is a complex mixture of organic compounds originating from the incomplete combustion of biomass. Many organic compounds absorb in the visible and near-UV regions strongly.
Sandradewi et al. have developed a method for quantifying BrC and BC from raw data provided from multi-wavelength, tape-based carbon monitors, such as the Met One Instruments BC 1054 or BC 1060. The algorithm requires as input parameters the Absorption Ångström Exponents “AAE” for BC and for BrC. The algorithm also requires load-corrected data at two wavelengths: typically 370-470 nm and 950 nm. AAEs have been demonstrated to vary considerably from site to site. The AAE for BC is typically around 1. The AAE for BrC is highly variable, ranging from 1 to more than 2 depending on the season, site, and biomass composition.
The Sandradewi method will output mass concentrations at the two selected wavelengths for carbon originating from biomass combustion and carbon originating from fossil fuel combustion.
The Aethalometer Model and wavelength changes at high concentrations
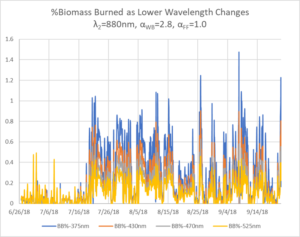
Using the aethalometer model method for determining BC concentrations from biomass burning (WB) and fossil fuel burning (BC), calculations were performed at various wavelengths on a ten wavelength BC 1054. The biomass AAE (αwb) was kept fixed at 2.8, and fossil fuel AAE (αff) was kept fixed at 1 in the equations. Charts used hourly averages from minute data.
There is a substantial change in concentration and percent biomass burned (BB%) at high concentrations when UV λ is changed, not so much when IR λ changed.
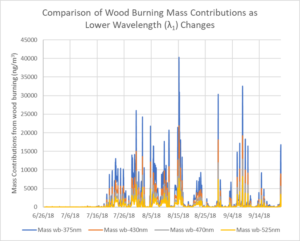
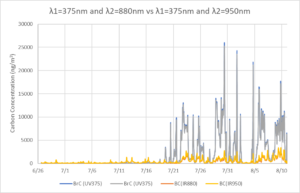
The following graph shows the BrC near-UV concentrations and BC near-IR concentrations calculated from the aethalometer model when the upper wavelength is changed, and λ1 is held constant at 370 nm. There is hardly any change in either concentration when near-IR wavelengths are changed.
Source Apportionment in Layman’s Terms
“Brown carbon concentrations are almost 22μg, while black carbon is about 1.5μg.” This may mean very little to an inexperienced field operator with a mission to source apportion carbonaceous particulate and determine if it is from biomass or fossil fuel. Using percentages derived from the aethalometer model can yield results greater than 1. Since brown and organic carbon components have strong UV absorption and black carbon absorption spans all visible wavelengths, we will assume that the difference between UV-derived concentrations minus IR-derived concentrations divided by UV-derived concentrations originates from biomass, and this will provide a percentage of biomass burned.
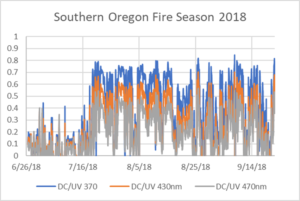
More than one fire location has been measured with our equipment, and a typical ratio of greater than 0.4 reveals significant biomass burning. The following graph is from the 2018 Southern Oregon fire season. Ratios decrease as the UV wavelength increases because less biomass absorbs at higher wavelengths. The near-IR wavelength used for these calculations was 880nm.
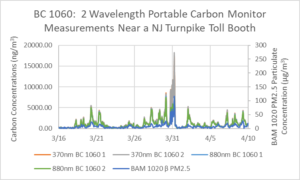
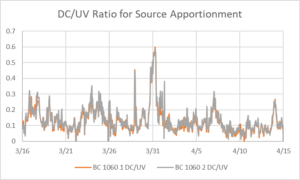
Another fire was apportioned by two BC 1060 2-wavelength portable black carbon monitors, also manufactured by Met One Instruments, Inc. The fire burned 11,638 acres in the Penn State Forest approximately 60 miles southwest of these black carbon monitors starting 3/30/19. The BC 1060 uses 370nm and 880nm wavelengths. DC/UV ratio increases over 0.4 when the biomass-laden particulate blew into the north with help from 25 mph southwesterly winds.